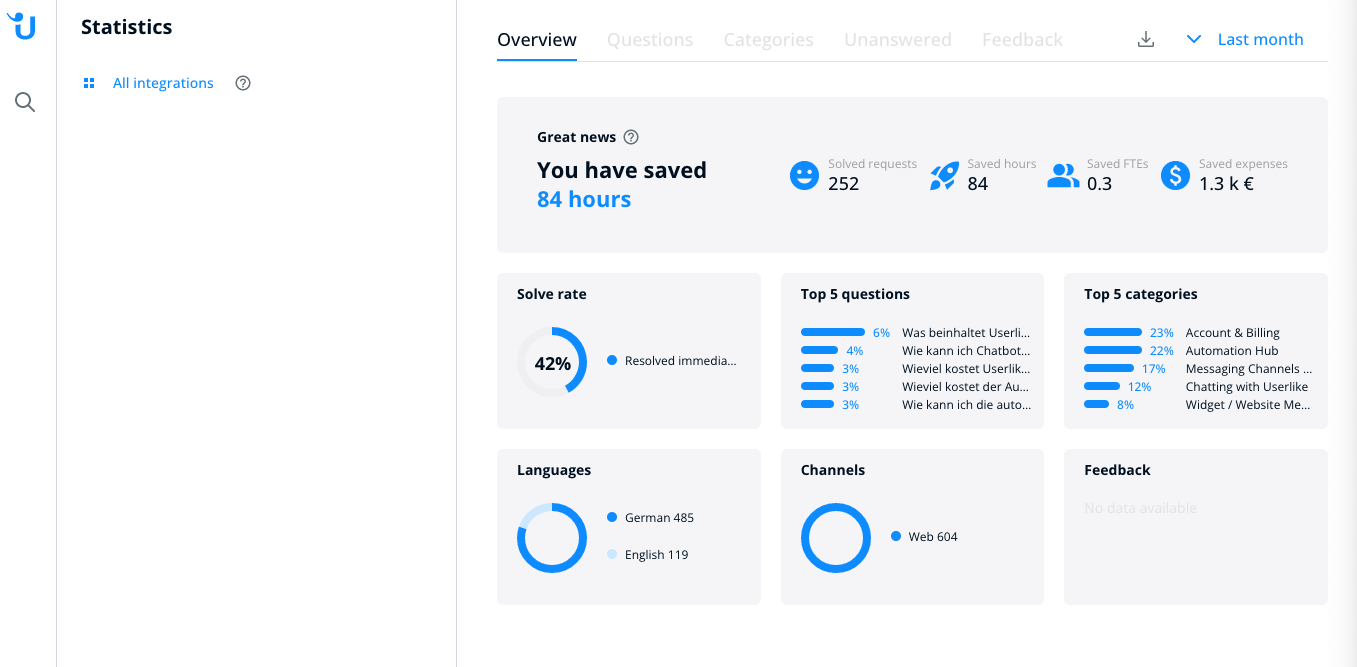
On the left side you will see all the different modules you’ve created in your AI Automation Hub. You can choose a module folder/category or a specific module. Choose “All integrations” to see the statistics of all modules combined.
On the upper right you can filter for a specific timeframe or choose one of the most common ones.
On the statistic startpage you find an overview of your data:
- hours saved
- solve rate
- top 5 questions
- top 5 categories
- languages
- channels

read this article in English:
https://docs.userlike.com/features/ai-automation-hub/statistics/general-statistics
