
Analytics dashboards
Analytics dashboards allow you to compile your own custom view with up to ten of the KPIs we offer. Build a dashboard featuring the KPIs you’re most interested in or individual dashboards for specific purposes, like operator statistics or a single Widget’s data. Select one of your dashboards as your default and it will always be the first thing you see when you open Analytics > Dashboards.
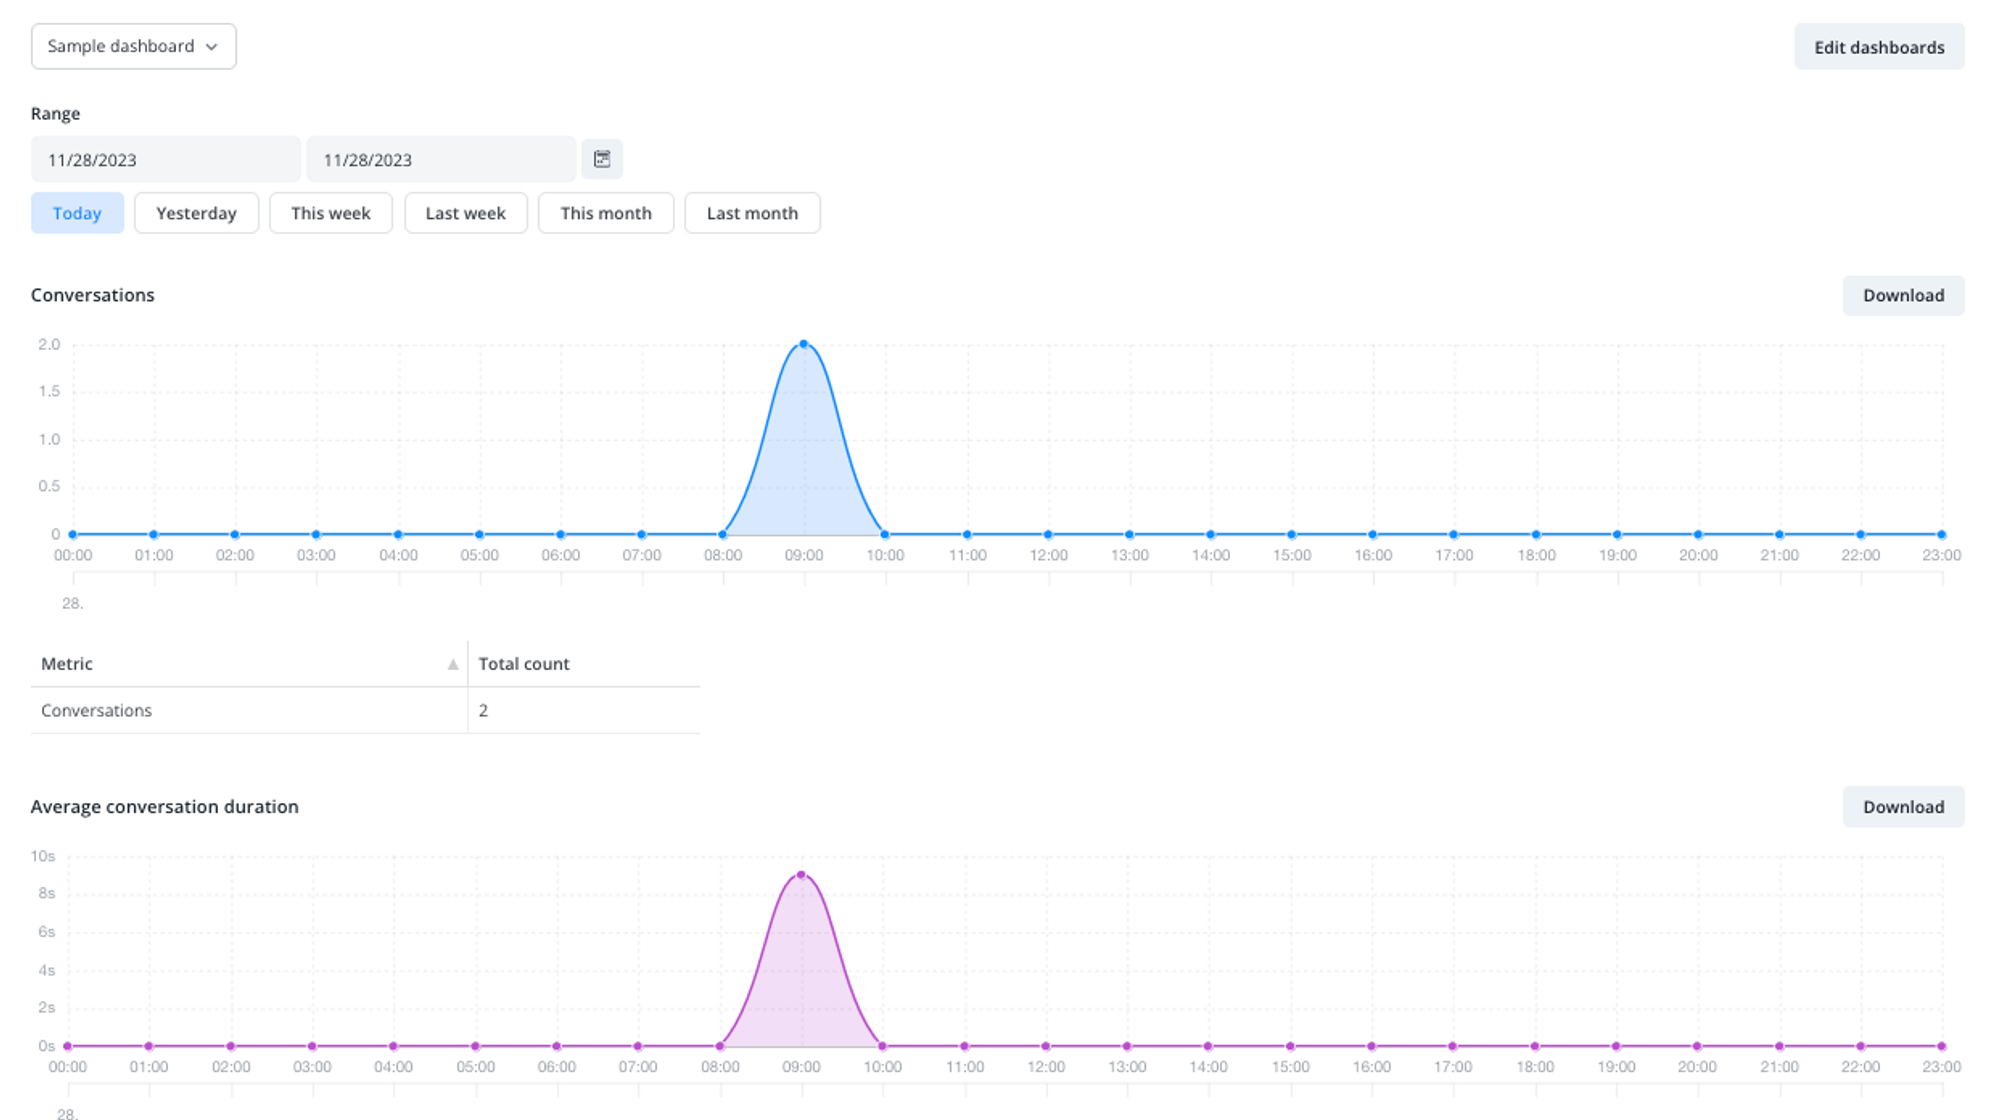
Click Edit dashboards to open an overview from which you can add, edit, clone and delete Analytics dashboards. Note that you cannot delete a dashboard as long as it is marked as your default.
In this view, you can define a name for your new dashboard and add KPIs. To add a KPI, click the “Add KPI” button in the KPI list and select its “KPI type”. You can drag KPIs up or down to
specify their position in the dashboard. If you leave a KPI's default name unchanged, it will be displayed to all operators in their respective profile language. So, if you have a multilingual team, it maybe better not to customize the names. To adjust a KPI’s name, just double-click it:
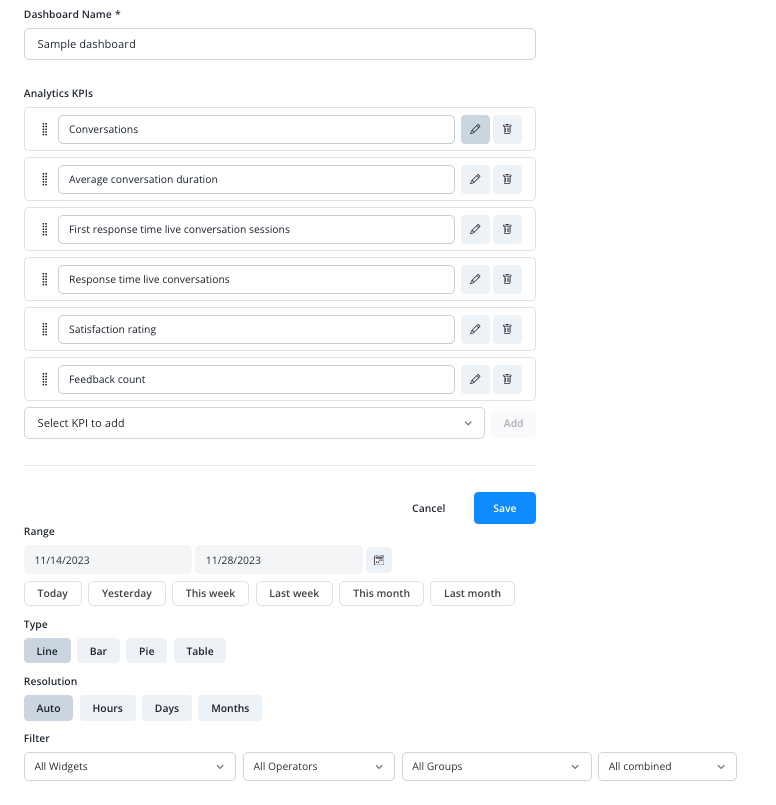
All settings are directly applied to your dashboard view, giving you a great range of options to configure it for your individual reporting needs.